
Midterms & Markets: Does History Matter?
Today's blog is written by Chris Fasciano, chief market strategist at Commonwealth. He represents Commonwealth in various media appearances, advisor speaking events, and Commonwealth conferences. He also oversees and mentors a dynamic team of investment research analysts who specialize in equity and fixed income markets. Prior to this role, Chris spent 10 years as one of the firm’s portfolio managers, involved with asset allocation and fund selection. With a deep background in small- and mid-cap stock research, Chris is uniquely positioned to analyze the latest economic data and offer valuable insights on navigating today’s volatile markets. Chris Fasciano is a guest writer and is not affiliated with LPL Financial.
The ongoing situation in the Middle East continues to drive markets in the short term. Oil production and shipping channels remain the focal point from an investor’s perspective as surging crude prices have led to concerns about the potential for accelerating inflation and higher interest rates. Until there is greater clarity around the duration of the conflict, this dynamic will remain critical to economic growth. My LPL colleagues have done an excellent job covering that topic, so let us switch gears and consider another topic that could be an issue for investors, if and when the military tensions begin to subside — midterm elections.
Historically, the State of the Union address has been the unofficial start of the midterm election campaign. With the president’s February 24 speech in the rearview mirror, election related headlines are likely to increase over the coming months and eventually work their way into investor psychology. What does history suggest markets might experience over the next several months?
Increased Rhetoric Leads to Muted Returns
Only three times has the party that is in the White House picked up seats in the House of Representatives during midterm elections. It occurred in 1934 with Franklin D. Roosevelt, 1998 with Bill Clinton, and 2002 with George W. Bush. The number of seats picked up was in the single digits. It is far more common for the president’s party to lose seats during midterm elections. On average, the loss of seats is in the mid-twenties, and the current consensus is for that to happen this year. Despite the predictability of this outcome, markets still tend to react ahead of Election Day.
Campaign rhetoric grows increasingly loud as Election Day approaches. Challengers tend to highlight things that are wrong with the current situation caused by policy failures or propose large pieces of legislation to solve economic and social problems. Layer on top of that, the potential for this campaign to take place against the backdrop of war and the daily headlines can weigh on nerves and investor anxiety. Markets, as always, do not like uncertainty.
S&P 500 Tends to Underperform in Midterm Years
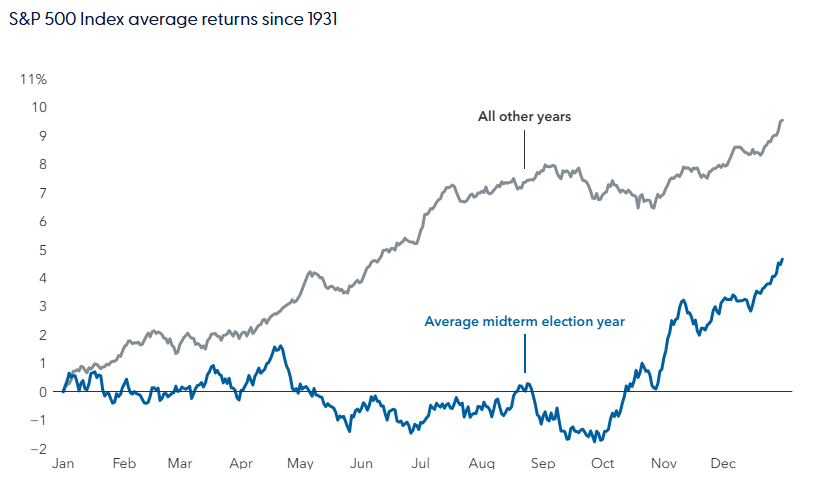
Source: LPL Research, Capital Group, RIMES, Standard & Poor’s 12/31/25. Disclosures: All indexes are unmanaged and cannot be invested in directly. Past performance is no guarantee of future results. The modern design of the S&P 500 stock index was first launched in 1957. Performance back to 1950 incorporates the performance of the predecessor index, the S&P 90.
The chart shows the average trajectory of cumulative price returns for the S&P 500 Index throughout midterm election years compared to non-midterm election years. Each point on the lines represents the average year-to-date return as of that particular month and day and is calculated using daily price returns from January 1, 1931, to December 31, 2025.
Midterm election years have average returns that are roughly five percentage points less than the other three years of a presidential term. Volatility also tends to increase in the six months prior to midterm elections. This combination, lower returns and higher volatility, helps explain why election years often feel more unsettling for investors, even when longer-term fundamentals remain intact.
The Third Year of the Presidential Cycle
Once the fog of the election season lifts, investors return to fundamental data in evaluating markets. In the third year of a presidential term, administrations often pivot toward pro-growth policies, whether to support reelection efforts, cement their legacy, or strengthen their parties for the next election cycle. This tends to lead to an improving economy, more supportive fiscal and regulatory policies, and a better outlook for corporate earnings. Taken together, these factors have historically made the year following midterms one of the strongest periods for equity market returns.
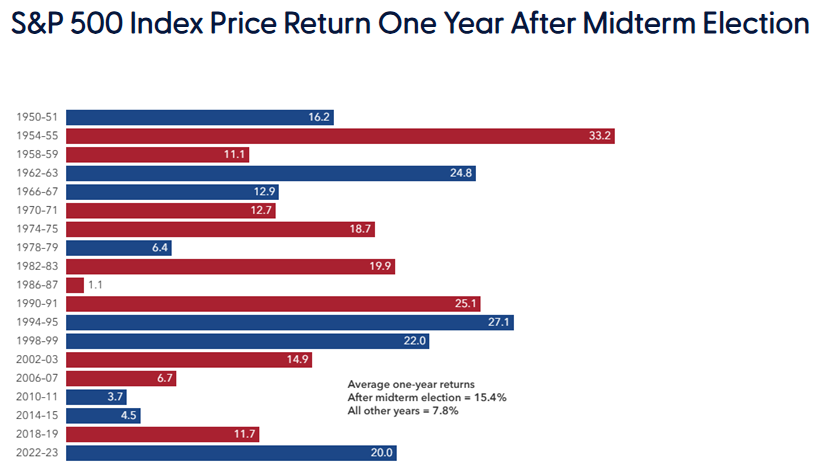
Red bars = Republican President; blue bars = Democrat President
Source: LPL Research, Capital Group, RIMES, Standard & Poor’s 01/15/26.
Disclosures: All indexes are unmanaged and cannot be invested in directly. Past performance is no guarantee of future results.
Calculations use Election Day as the starting date in all election years and November 5 as a proxy for the starting date in other years. Only midterm election years are shown in the chart.
And it happens no matter what party controls the White House, Senate, or House of Representatives. Markets appear far more responsive to reduced uncertainty and improving growth expectations than to the power sharing arrangement in Washington.
Everything Else Matters
While the data tells an understandable story given the level of angst that accompanies election years, election years don’t occur in a vacuum. Other factors impact markets, and it is hard to separate what is driving the market day-to-day and month-to-month. Geopolitical risk is always a concern and it is the most important risk currently. The impact of higher oil prices on jobs creation and the path of inflation will play a major role in how the Federal Reserve (Fed) will approach interest rate policy as the year unfolds. These decisions could have an impact on economic growth, which would be important for yields on the 10-year Treasury bond and corporate earnings. Over the long term, interest rates and earnings are the key drivers to what valuation levels stocks will ultimately trade at, not election outcomes alone.
Portfolio Positioning
Higher oil prices are challenging the consensus views of an economy that was expected to accelerate as the year unfolds and a Fed that would reduce interest rates as inflation moderates. Rhetoric along the campaign trail could also potentially do the same thing. And for the remainder of this year, those issues could be intertwined.
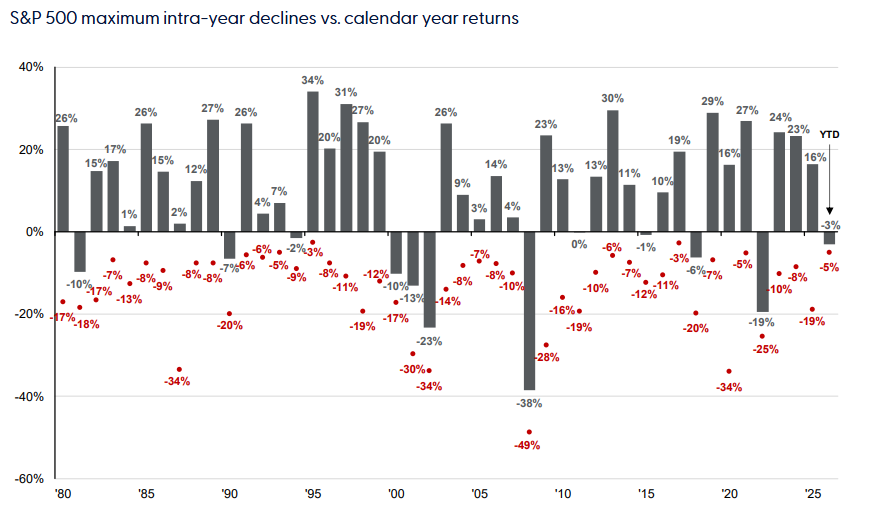
Periods of market stress are almost inevitable. Historically, the average calendar year includes a drawdown of roughly 14% at some point, even in otherwise strong years.
Sell-Offs Happen Every Year, But Are Often Short-Lived
Source: LPL Research, FactSet, Standard & Poor’s, J.P. Morgan Asset Management 03/13/26.
Disclosures: All indexes are unmanaged and cannot be invested in directly. Past performance is no guarantee of future results.
Returns are based on price index only and do not include dividends. Despite average intra-year drops of 14.2%, annual returns were positive in 35 of 46 years. Intra-year drops refer to the largest peak-to-trough decline during the year. Returns shown are calendar-year returns from 1980 to 2025, over which the average annual return was 10.7%.
The famous Fidelity portfolio manager, Peter Lynch, once observed that “people have lost more money preparing for a correction than they actually do in a correction.” History supports that insight. Despite the selloffs that have and will continue to occur every year, in the last 23 years, there have only been three years in which market returns have declined by more than 1%. Please note that past performance does not guarantee future results.
As a result, wholesale changes in portfolios in response to headlines, whether geopolitical or political, are rarely warranted. Be on the lookout for any changing fundamentals, remain diversified, and focus on long-term objectives.
Well-constructed portfolios are designed to participate in market upside while managing risk during inevitable periods of weakness. We believe the best investment strategy during an election year is to vote in the booth, not in your portfolios.
Important Disclosures
This material is for general information only and is not intended to provide specific advice or recommendations for any individual. There is no assurance that the views or strategies discussed are suitable for all investors. To determine which investment(s) may be appropriate for you, please consult your financial professional prior to investing.
Investing involves risks including possible loss of principal. No investment strategy or risk management technique can guarantee return or eliminate risk.
Indexes are unmanaged and cannot be invested into directly. Index performance is not indicative of the performance of any investment and does not reflect fees, expenses, or sales charges. All performance referenced is historical and is no guarantee of future results.
This material was prepared by LPL Financial, LLC. All information is believed to be from reliable sources; however LPL Financial makes no representation as to its completeness or accuracy.
Unless otherwise stated LPL Financial and the third party persons and firms mentioned are not affiliates of each other and make no representation with respect to each other. Any company names noted herein are for educational purposes only and not an indication of trading intent or a solicitation of their products or services.
Asset Class Disclosures –
International investing involves special risks such as currency fluctuation and political instability and may not be suitable for all investors. These risks are often heightened for investments in emerging markets.
Bonds are subject to market and interest rate risk if sold prior to maturity.
Municipal bonds are subject and market and interest rate risk and potentially capital gains tax if sold prior to maturity. Interest income may be subject to the alternative minimum tax. Municipal bonds are federally tax-free but other state and local taxes may apply.
Preferred stock dividends are paid at the discretion of the issuing company. Preferred stocks are subject to interest rate and credit risk. They may be subject to a call features.
Alternative investments may not be suitable for all investors and involve special risks such as leveraging the investment, potential adverse market forces, regulatory changes and potentially illiquidity. The strategies employed in the management of alternative investments may accelerate the velocity of potential losses.
Mortgage backed securities are subject to credit, default, prepayment, extension, market and interest rate risk.
High yield/junk bonds (grade BB or below) are below investment grade securities, and are subject to higher interest rate, credit, and liquidity risks than those graded BBB and above. They generally should be part of a diversified portfolio for sophisticated investors.
Precious metal investing involves greater fluctuation and potential for losses.
The fast price swings of commodities will result in significant volatility in an investor's holdings.
This research material has been prepared by LPL Financial LLC.
Not Insured by FDIC/NCUA or Any Other Government Agency | Not Bank/Credit Union Deposits or Obligations | Not Bank/Credit Union Guaranteed | May Lose Value
For Public Use – Tracking: #1080147